Microsoft Excel is a tool which has many uses, the most common of which are performing calculations and plotting graphs.
When you open Microsoft Excel you will see a grid. Each box in the grid is called a cell. Each cell has an "address" made up of a letter indicating the column the cell is in and a number indicating the row the cell is in. For example, the upper left cell is A1.
The first step in doing a spreadsheet calculation or making a graph is entering the data.
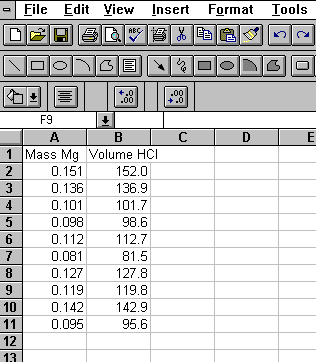
For example, if we did an experiment reacting several different samples of magnesium metal with hydrochloric acid, we might want to set up a spreadsheet containing the mass of magnesium and volume of hydrochloric acid used. We would create a spreadsheet that looks like figure 1.
Figure 1: Simple Spreadsheet
Each number in column A contains a mass of magnesium used in the experiment, and each number in column B contains the volume of HCl with which the mass in column A reacted.
In order to enter data into a cell, the cell must be outlined by a dark box. This box may be moved with the arrow keys or by clicking on a desired cell with the mouse.
Note: When making a graph, it is important to always enter the data in adjacent columns. The x data always goes on the left of the y data.
![]()