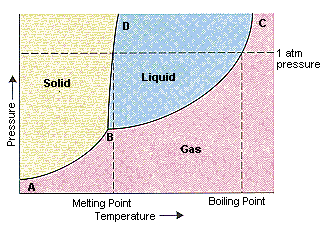
The figure below shows an example of a phase diagram, which summarizes the effect of temperature and pressure on a substance in a closed container. Every point in this diagram represents a possible combination of temperature and pressure for the system. The diagram is divided into three areas, which represent the solid, liquid, and gaseous states of the substance.

The best way to remember which area corresponds to each of these states is to remember the conditions of temperature and pressure that are most likely to be associated with a solid, a liquid, and a gas. Low temperatures and high pressures favor the formation of a solid. Gases, on the other hand, are most likely to be found at high temperatures and low pressures. Liquids lie between these extremes.
You can therefore test whether you have correctly labeled a phase diagram by drawing a line from left to right across the top of the diagram, which corresponds to an increase in the temperature of the system at constant pressure. When a solid is heated at constant pressure, it melts to form a liquid, which eventually boils to form a gas.
Phase diagrams can be used in several ways. We can focus on the regions separated by the lines in these diagrams, and get some idea of the conditions of temperature and pressure that are most likely to produce a gas, a liquid, or a solid. We can also focus on the lines that divide the diagram into states, which represent the combinations of temperature and pressure at which two states are in equilibrium.
The points along the line connecting points A and B in the phase diagram in the figure above represent all combinations of temperature and pressure at which the solid is in equilibrium with the gas. At these temperatures and pressures, the rate at which the solid sublimes to form a gas is equal to the rate at which the gas condenses to form a solid.
| Along AB line: | ||||
| rate at which solid sublimes to form a gas | = | rate at which gas condenses to form a solid |
The solid line between points B and C is identical to the plot of temperature dependence of the vapor pressure of the liquid. It contains all of the combinations of temperature and pressure at which the liquid boils. At every point along this line, the liquid boils to form a gas and the gas condenses to form a liquid at the same rate.
| Along BC line: | ||||
| rate at which liquid boils to form a gas | = | rate at which gas condenses to form a liquid |
The solid line between points B and D contains the combinations of temperature and pressure at which the solid and liquid are in equilibrium. At every point along this line, the solid melts at the same rate at which the liquid freezes.
| Along BD line: | ||||
| rate at which solid melts to form a liquid | = | rate at which liquid freezes to form a solid |
The BD line is almost vertical because the melting point of a solid is not very sensitive to changes in pressure. For most compounds, this line has a small positive slope, as shown in the figure above. The slope of this line is slightly negative for water, however. As a result, water can melt at temperatures near its freezing point when subjected to pressure. The ease with which ice skaters glide across a frozen pond can be explained by the fact that the pressure exerted by their skates melts a small portion of the ice that lies beneath the blades.
Point B in this phase diagram represents the only combination of temperature and pressure at which a pure substance can exist simultaneously as a solid, a liquid, and a gas. It is therefore called the triple point of the substance, and it represents the only point in the phase diagram in which all three states are in equilibrium. Point C is the critical point of the substance, which is the highest temperature and pressure at which a gas and a liquid can coexist at equilibrium.
The figure below shows what happens when we draw a horizontal line across a phase diagram at a pressure of exactly 1 atm. This line crosses the line between points B and D at the melting point of the substance because solids normally melt at the temperature at which the solid and liquid are in equilibrium at 1 atm pressure. The line crosses the line between points B and C at the boiling point of the substance because the normal boiling point of a liquid is the temperature at which the liquid and gas are in equilibrium at 1 atm pressure and the vapor pressure of the liquid is therefore equal to 1 atm.

